We’ve said it before and we’ll say it again: Sequencing is the key to the pitching delivery.
To throw a baseball efficiently, a pitcher must get into the right position at the right time with the right succession of movements, like dominoes falling. If a domino falls too early or too late, it disrupts the other dominoes. This is the kinematic sequence. Energy is transferred from the ground up, through a pitcher’s legs, into the hips, shoulders and arms, and finally into the fingertips and then the baseball. But, there is a slight delay between each body segment, when it decelerates before energy is delivered to the next segment. Think of it as the cracking of a whip; each segment does the same start and stop until the end of the whip pops.
“We pay so much attention to hips delivering shoulders, shoulders delivering arm and arm delivering baseball in the right sequence in the right time because it’s the easiest way to throw hard,” says coach Tom House. “You can throw hard if you’re out of sequence, but you have to make up for it by recruiting muscle or moving inappropriately for better leverage, which means you probably don’t throw strikes and you probably aren’t healthy. But if your kinematic sequencing is correct, you have good command and you throw hard, easy, like Nolan Ryan.”
So you can more clearly visualize what the kinematic sequence looks like in the pitching delivery, we have added sequencing charts to the Mustard app. But yes, we know. To the untrained eye, these charts are a bit hard to interpret; we’ve heard them compared to Jackson Pollock paintings, Silly String and colorful spaghetti. So, let us explain, with the help of Coach House and several of the best coaches and biomechanists in the country: Doctors Greg Rose and Jimmy Buffi and coach Dean Doxakis.
Understanding a Sequencing Chart
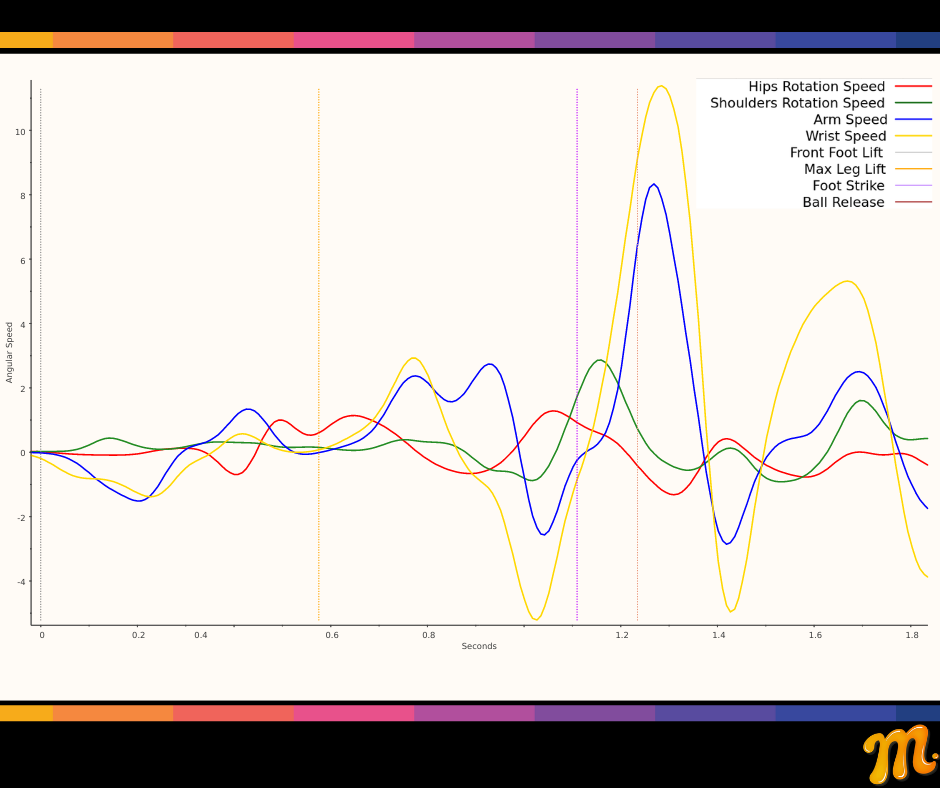
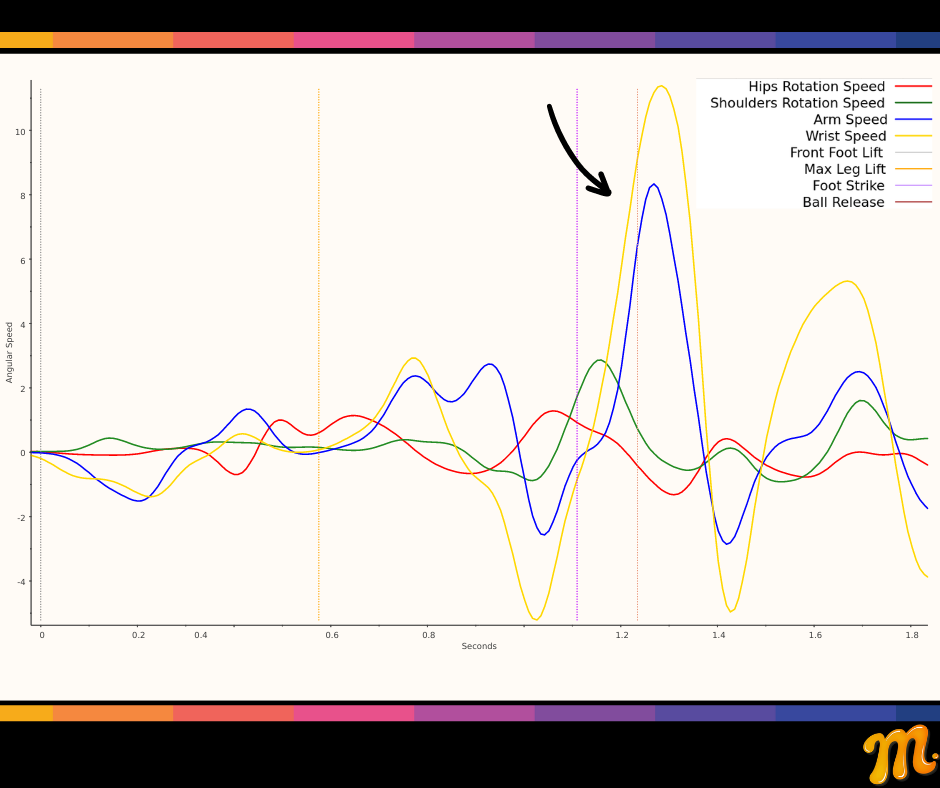
The kinematic sequencing chart plots a pitcher’s movement. Time in seconds is plotted on the X axis, or horizontal line. Angular Velocity, in degrees per second, is plotted on the Y axis, or vertical line. The chart shows the angular velocity of a pitcher’s hips, shoulders, arm and wrist over the course of the delivery. The dotted, vertical lines on the chart show specific points in time— front foot lift, max leg lift, foot strike and ball release—and allow you to see the angular velocity of your different body parts at those pivotal points in the delivery. As explained in our blog on timing and stride length, foot strike should optimally occur in one second or less. You will see the colored lines representing movement of your body parts—most notably, the blue and yellow lines representing your arm and wrist—prior to foot strike, as this is when the hands break and lift. However, the most important part of the sequencing chart is what happens between foot strike and ball release .25 to .35 seconds later.
A Perfect Sequencing Chart
Let’s start by being absolutely clear about the fact that we fabricated this perfect kinematic sequencing chart, because it’s almost impossible to be perfect. But, that doesn’t mean you shouldn’t strive to have perfect sequencing! “In a perfect sequencing chart, the peak of the first body part in the sequence—the hips—would be on the vertical line of the second body part in the sequence—the shoulders—and so forth,” explains National Pitching Association vice president Dean Doxakis. “If we see the peak of the line for the arm or wrist ahead of the shoulder line, you know you’re out of sequence and you’re throwing too early.”
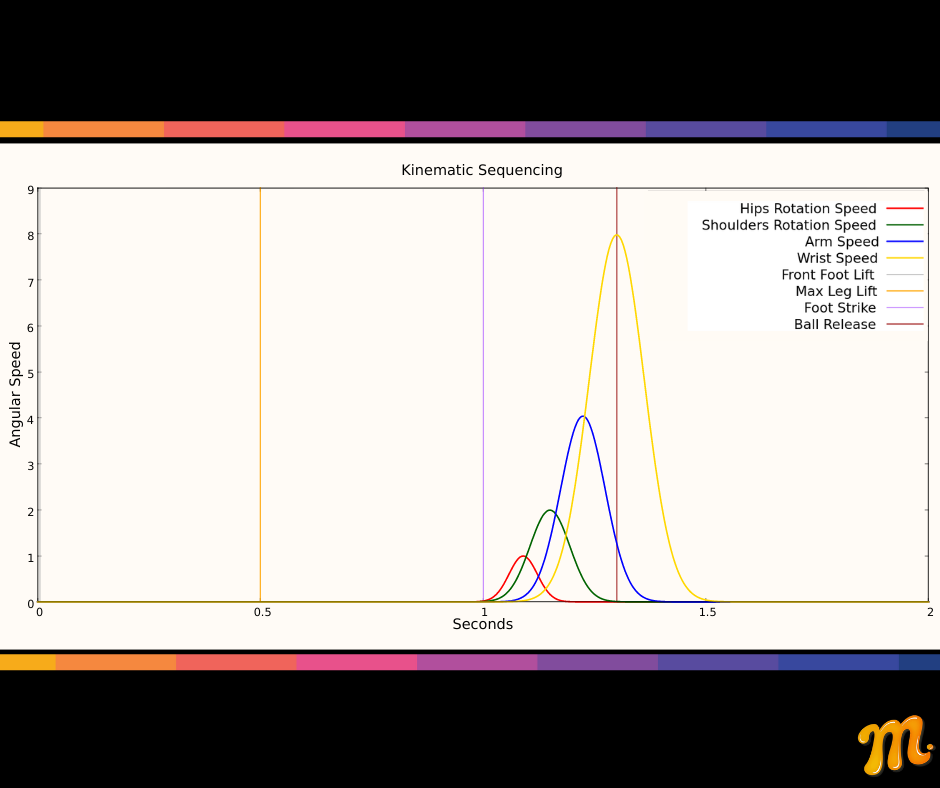
House further explains that in a perfect graph, the lines representing the successive body parts in the sequence should look like ski slopes that are increasing in size. “If the hips are X, the shoulders should be 2X, the arm should be 4X and the wrist should be 8X,” says House. “So, after the first ski slope, which is the hips, the second, representing the shoulders, should be twice as big, the third, representing the arm, should be four times as big, and the last, representing the wrist, should be eight times as big.” And, if your timing is efficient, those ski slopes should all fit between foot strike at 1.0 seconds and ball release by 1.35 seconds.
A Not-So-Perfect Sequencing Chart: Small Hips
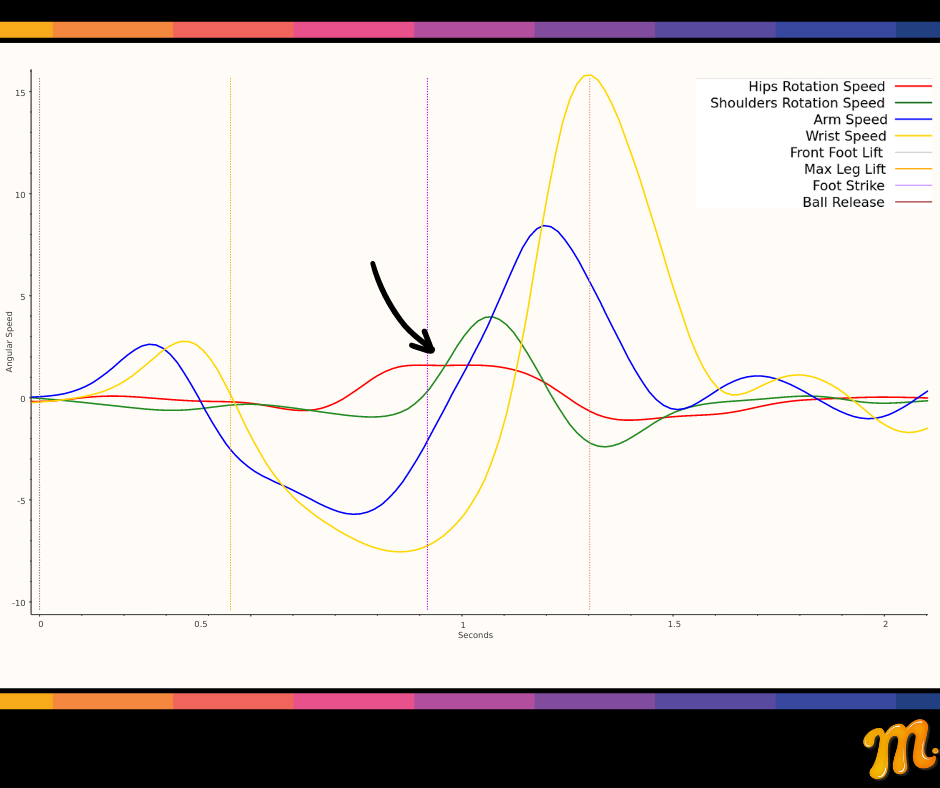
In the chart above, the pitcher is moving in the proper kinematic sequence, but the hips take too long to stop rotating; the red line representing the hips does not dip before the green line representing the shoulders goes up. “Nobody’s hips are perfect, but in good deliveries, the hips slow down and stop to deliver energy to the shoulders,” explains House. “This pitcher is a little sloppy with the hips, which tells me there is a strength or flexibility issue, or both.” Additionally, the green shoulder line is directly over the red hip line. “If the hips and shoulders are right on top of each other, there isn’t enough separation, and the pitcher isn’t storing enough torque to throw hard, easy,” says House.
A Not-So-Perfect Sequencing Chart: Front-Side Flyer
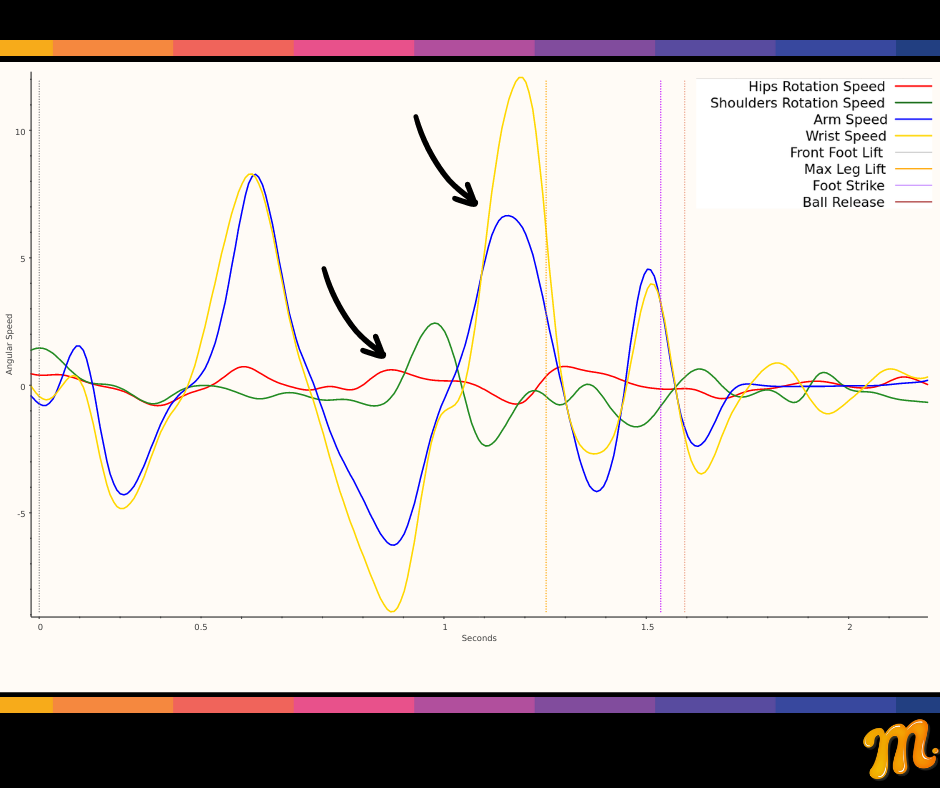
In this chart, the pitcher is lacking hip and shoulder separation, as shown by the green shoulder line happening at the same time as the hips. But, the blue line representing the arm and the yellow line representing the wrist are also happening at the same time. “That tells me this pitcher is a premature rotator, throwing mostly with muscle, who will be more prone to injury,” explains House. “Imagine a right-handed Little Leaguer who leans way over toward first base, whose release point ends up at or behind the head.” House also suggests that this chart likely belongs to a youngster who does not yet have a lot of strength who is pulling the arm through rather than using the shoulder to deliver it.
Tips from the Experts
Jimmy Buffi, Former LA Dodgers Analyst & Founder of Reboot Motion
Kinematic sequencing charts are complicated, and Buffi cautions that they are just a portion of the story of any pitching delivery. So, instead of getting caught up in all those colorful lines, he suggests focusing on two things: Order and deceleration. “Maybe even simpler than the order of all the parts of the delivery is, ‘Are the hips first?’” Buffi says. “That’s a precursor to having very good hip and shoulder separation, which is a foundation for the whole delivery, so ensuring your hips are separating from your shoulders is a big thing.”
If you want to go further into the weeds, Buffi points to deceleration. The line representing each part of the body should go up, reach a peak and come down, showing that it is accelerating, reaching peak velocity, and then decelerating as the line representing the next body part goes up. “That’s the mechanism,” Buffi explains. “The hips accelerate and gain energy, but in order to pass than energy upward, the hips have to lose energy. The hips decelerating is what gives energy to the torso.” So, pay attention to the downward slopes in addition to the upward ones. If you see a body part where the downward slope doesn’t happen quickly or sharply, that could be a cue that you need to work on deceleration, which can improve things up the chain.
Dr. Greg Rose, Co-Founder of the Titleist Performance Institute
“Kinematic sequencing charts take style out of the picture and show how effective you are,” says Rose. “They show whether or not what you are doing is working.” Rose also likens the pitching delivery to the cracking of a whip. If the lower body is the handle of the whip, it needs to go first, and it needs to go fast, but the second part of the whip—your trunk—needs to go faster. Then, the throwing arm elbow needs to extend third and go faster than the trunk, and of course, the tip of the whip—forearm rotation—should go last and the fastest. “The best players in the world start from the ground and transfer energy up through their body, gaining speed throughout the delivery,” Rose explains. “On a sequencing chart, you can quickly see if the peaks of the red, green, blue and yellow are progressively higher, from left to right.”
A Note About Towels
You all know we at Mustard love towel drills, as they allow you to practice your full delivery without the wear and tear on muscles and joints created by throwing the baseball. And yes, you can get both a Mustard report card and a sequencing chart while doing the towel drill. The above sequencing chart belongs to a professional pitcher with very good sequencing, but it was created during a towel drill, not an actual pitch. Because the towel is not heavy enough to create sufficient lay back, or external rotation, of the forearm, you see the blue line of the arm directly under the yellow line of the wrist.
If you’d like more great content from Mustard, and you’d like to evaluate and improve your own pitching mechanics, download the Mustard pitching app today!